News Releases
First Mining Finance Announces Positive Preliminary Economic Assessment for its Springpole Gold Project
Estimated after-tax NPV5% of US$792 million and 26.2% IRR for the Springpole Gold Project at base case long-term precious metal prices
September 21, 2017
Vancouver, British Columbia – First Mining Finance Corp. (“First Mining” or the “Company”) is pleased to announce the positive results of an independent Preliminary Economic Assessment (“PEA”) for its Springpole Gold Project (the “Project”) in northwestern Ontario, Canada. The PEA was prepared in accordance with National Instrument 43-101 Standards of Disclosure for Mineral Projects (“NI 43-101”) by SRK Consulting (Canada) Inc. of Vancouver, Canada. The PEA describes the potential technical and economic viability of establishing a conventional open-pit gold mine-and-mill complex for the Project. The base case scenario utilizes long-term metal prices of $1,300 per ounce (“oz”) of gold (“Au”) and $20 per oz of silver (“Ag”).
The PEA was prepared on a 100% ownership basis and all amounts in this news release are stated in U.S. dollars (“USD”) unless otherwise noted.
Highlights of the PEA are as follows:
- Initial capital expenditure of $586 million and sustaining capital expenditures of $117 million for total estimated capital expenditures of $703 million over the projected 12-year mine life (LOM). In addition, closure and reclamation costs are estimated at $20 million.
- Pre-tax Net Present Value (“NPV”) at a 5% discount rate of $1.159 billion calculated at the beginning of the two-year construction period and a pre-tax Internal Rate of Return (“IRR”) of 32.3% for the base case.
- After-tax NPV at a 5% discount rate of $792 million and after-tax IRR of 26.2% for the base case.
- Estimated payback of initial capital in 3.5 years from the commencement of commercial production.
- Estimated 12-year LOM operation supporting a 36,000 tonne-per-day (“tpd”) process plant that includes crushing, grinding, carbon-in-pulp leaching as well as gold recovery via activated carbon to produce doré bullion.
- LOM strip ratio of 2.1 to 1.
- Average annual payable production projected to be 296,500 oz Au and 1,632,000 oz Ag for LOM with average production for the nine years at full capacity of 357,100 oz Au and 2,038,800 oz Ag per annum.
- Estimated cash costs of $619/oz gold equivalent (“AuEq”) (cash costs include on-site mining, processing and G&A costs, treatment and refining charges and royalties).
- “All-in” cash costs (in addition to cash costs including initial/sustaining capital and mine closure) estimated at $806/oz of AuEq.
- Recommends moving forward with a pre-feasibility study.
- The Company is working towards the filling of an Environmental Assessment in Q1 2018.
“This updated PEA study represents a significant improvement in both economics and annual and total ounces of gold and silver produced when compared with the previous PEA completed for Gold Canyon in 2013. The PEA demonstrates that the Project has excellent margins with low cash costs of US$619 per ounce of gold equivalent and an average annual payable production of 322,000 ounces of gold equivalent, over the life of mine. On that basis, once in production as contemplated by the PEA, Springpole would be one of the largest gold mines in North America,” said Keith Neumeyer, First Mining’s Chairman.
Readers are cautioned that the PEA is preliminary in nature, it includes inferred mineral resources that are considered too speculative geologically to have the economic considerations applied to them that would enable them to be categorized as mineral reserves, and there is no certainty that the PEA will be realized. Mineral resources that are not mineral reserves do not have demonstrated economic viability.
Preliminary Economic Assessment – Project Economics:
The results of a discounted cash flow analysis for the Project are presented in Tables 1 and 2 below. NPV, IRR and payback values are estimated for both pre-tax and post-tax scenarios. The base case scenario utilizes the long-term metal prices outlined in Table 3 and a discount rate of 5%. IRR and NPV values are calculated at gold and silver prices of $1,300 and $20 per oz, respectively.
Table 1 – Pre-tax discounted cash flow estimates for varying gold prices
| Pre-Tax NPV* ($M) |
Gold Price ($/oz) | |||||
| 1,000 | 1,150 | Base Case 1,300 |
1,450 | 1,600 | ||
| Discount Rates | 3% | 592 | 1,000 | 1,409 | 1,817 | 2,226 |
| Base Case 5% | 457 | 808 | 1,159 | 1,510 | 1,861 | |
| 8% | 297 | 580 | 863 | 1,145 | 1,429 | |
| IRR % | 18.1 | 25.7 | 32.3 | 38.2 | 43.6 | |
| Payback (production) Years | 4.3 | 3.6 | 3.2 | 2.8 | 2.5 | |
* Assumes base case metals prices of $1,300/oz gold and $20/oz silver and discount rate of NPV 5%
Table 2 – After-tax discounted cash flow estimates for varying gold prices
| Post-Tax NPV* ($M) |
Gold Price ($/oz) | |||||
| 1,000 | 1,150 | Base Case 1,300 | 1,450 | 1,600 | ||
| Discount Rates | 3% | 394 | 686 | 977 | 1,268 | 1,558 |
| Base Case 5% | 290 | 541 | 792 | 1,042 | 1,292 | |
| 8% | 168 | 370 | 572 | 774 | 975 | |
| IRR % | 14.4 | 20.8 | 26.2 | 31.1 | 35.7 | |
| Payback (production) Years | 4.2 | 3.5 | 3.1 | 2.7 | 2.4 | |
*Assumes base case metals prices of $1,300/oz gold and $20/oz silver, and a discount rate of NPV 5%.
Mining and Processing
The PEA is based on a conventional truck-and-shovel, open-pit mine design at a single pit with milling, crushing, grinding, carbon-in-pulp leaching. Gold recovery is via an activated carbon process to produce doré bullion bars. Based on the preliminary metallurgical work undertaken for the Project, the average recoveries are projected to be 80% for gold and 85% for silver. The mineralized material at the Project will be processed through conventional milling and processing for an estimated LOM of 12 years. Total processing is based on a 36,000 tpd operation. Key parameters and assumptions used in the PEA study are discussed below and summarized in Tables 3 through 5.
Table 3 – Mining rates and volumes of mined material
| Type of Mining | Total Years | Avg. Tonnes/year (000’s) | Avg. Tonnes/day | Total Tonnes (000’s) |
| Open-pit mineralized material (Yrs 0 – 11) | 11 | 13,764 | 37,711 | 151,408 |
| Open-pit waste (Yrs 0 – 11) | 11 | 29,000 | 79,453 | 319,002 |
| Total material mined | 470,411 | |||
| Average strip ratio for the life of mine | 2.1 | |||
Table 4 – Projected metal production
| Metal | Total Payable Production | Avg. Annual Production Life of Mine |
| oz (000’s) | oz (000’s) | |
| Gold | 3,558 | 297 |
| Silver | 19,583 | 1,632 |
Table 5 – Base case head grades, recoveries, metal prices, and other data
| Head Grades | |
| Gold (g/t) | 1.00 |
| Silver (g/t) | 5.28 |
| Metal Recoveries | |
| Gold (%) | 80.0 |
| Silver (%) | 85.0 |
| Payables | |
| Payable Gold (%) | 99.5 |
| Payable Silver (%) | 98.0 |
| Metal Prices | |
| Gold ($/oz) | 1,300 |
| Silver ($/oz) | 20 |
| Other Parameters | |
| Life of mine (years) | 12 |
| Fuel price ($/l) | 0.78 |
| Electrical power ($/kWh) | 0.08 |
| Exchange rate (CAD/USD) | 0.75 |
Capital Costs
Mining capital costs, as detailed in Table 6, were estimated on the basis of a detailed equipment schedule matched to the mining production schedule. Total mining equipment capital costs were estimated at $193 million for the life of the Project inclusive of a 10% contingency and a 5% spares allowance.
Processing capital costs for mill and plant infrastructure were estimated to be $252 million inclusive of a $30 million contingency. No major plant rebuild or expansion is considered in the evaluated production scenario. No specific allowance for sustaining capital has been made and the PEA assumes that the ongoing operating maintenance cost is sufficient to maintain the equipment in operating condition. No allowance for salvage value was made.
Table 6 – Capital estimate summary
| Initial Capital Estimate ($M) | |
| Pre-production Capital Cost | 7 |
| Open Pit Mining | 143 |
| Dike and Lake Dewatering | 32 |
| Process Plant | 252 |
| Tailings Management Facility | 27 |
| Infrastructure | 112 |
| Water Management | 13 |
| Initial Development Capital | 586 |
| Sustaining Capital Estimate ($M) | |
| Open Pit Mining | 50 |
| Infrastructure | 8 |
| Tailings Management Facility | 60 |
| Total Sustaining Capital | 117 |
| Total Capital Expenditure for Life of Mine ($M) | 703 |
| Closure Costs | 20 |
| Total Capital Costs ($M) | 723 |
Rounding may result in apparent summation differences.
Operating Costs
The PEA estimates that the Project can produce approximately 296,500 ounces of payable gold per year and approximately 1,632,000 ounces of payable silver per year at an estimated total cash cost of $619/oz gold equivalent over the estimated 12 year LOM. Maintenance, parts and repairs are estimated based on industry standard factors for these costs. Mining costs are estimated at $1.60 per tonne of material mined, at a strip ratio of 2.1 which equates to $5.30 per tonne of material processed. Details of the estimated operating costs, and other charges, are presented in Tables 7 and 8 below.
Table 7 – Operating costs per tonne processed
| Item | $/tonne processed |
| Mining | 5.3 |
| Processing | 7.5 |
| General and Administrative | 1.8 |
| Tailings Handling | 1.5 |
| Total On-site Operating Costs | 16.0 |
Table 8 – Treatment and refining charges and royalties
| Item | Units | |
| Royalty Rate | % | 3.0 |
| Gold Refining Cost Estimate | $/oz | 5.0 |
| Payable Gold Assumption | % | 99.5 |
| Payable Silver Assumption | % | 98.0 |
Infrastructure
A 60 km long by 23 m wide right-of-way will need to be cleared, grubbed and prepared for the installation of a 115 kV wood pole transmission line using 636,000 mils conductor. The proposed right-of-way would start from Highway 105 near Ear Falls and travel a further 90 km alongside the existing Hydro One corridor overland where it would connect to and follow the access corridor road to the project site.
A 12 m wide, two-lane unpaved, 39 km access corridor road would extend from the Springpole deposit along the Birch River before it connects up with the planned Wenasaga Road. Other road options are also being considered.
Springpole Lake Dewatering
As seen in Figure 1 below, three dewatering dikes with a total length of approximately 510 metres will need to be constructed in Springpole Lake to allow a small portion of the lake to be dewatered. It is estimated that only approximately 6.1% of the surface area of the lake will be affected. The depth of the lake at the point where the dikes are proposed to be constructed ranges from 1.2 to 5.1 metres and the height of the dikes will need to be 3 metres above the lake level. The dikes would be constructed under wet conditions; therefore, two silt entrapment curtains will need to be deployed downstream of the dike locations to prevent high suspended solids in the remainder of the lake. Prior to the placement of fill material, the foundation of the dam will need to be dredged to remove any soft lakebed sediments. The rock fill material would be placed, and then the grout curtain and plastic concrete cut-off wall would be built through the completed dike.
Figure 1 – Overall Springpole Site Plan
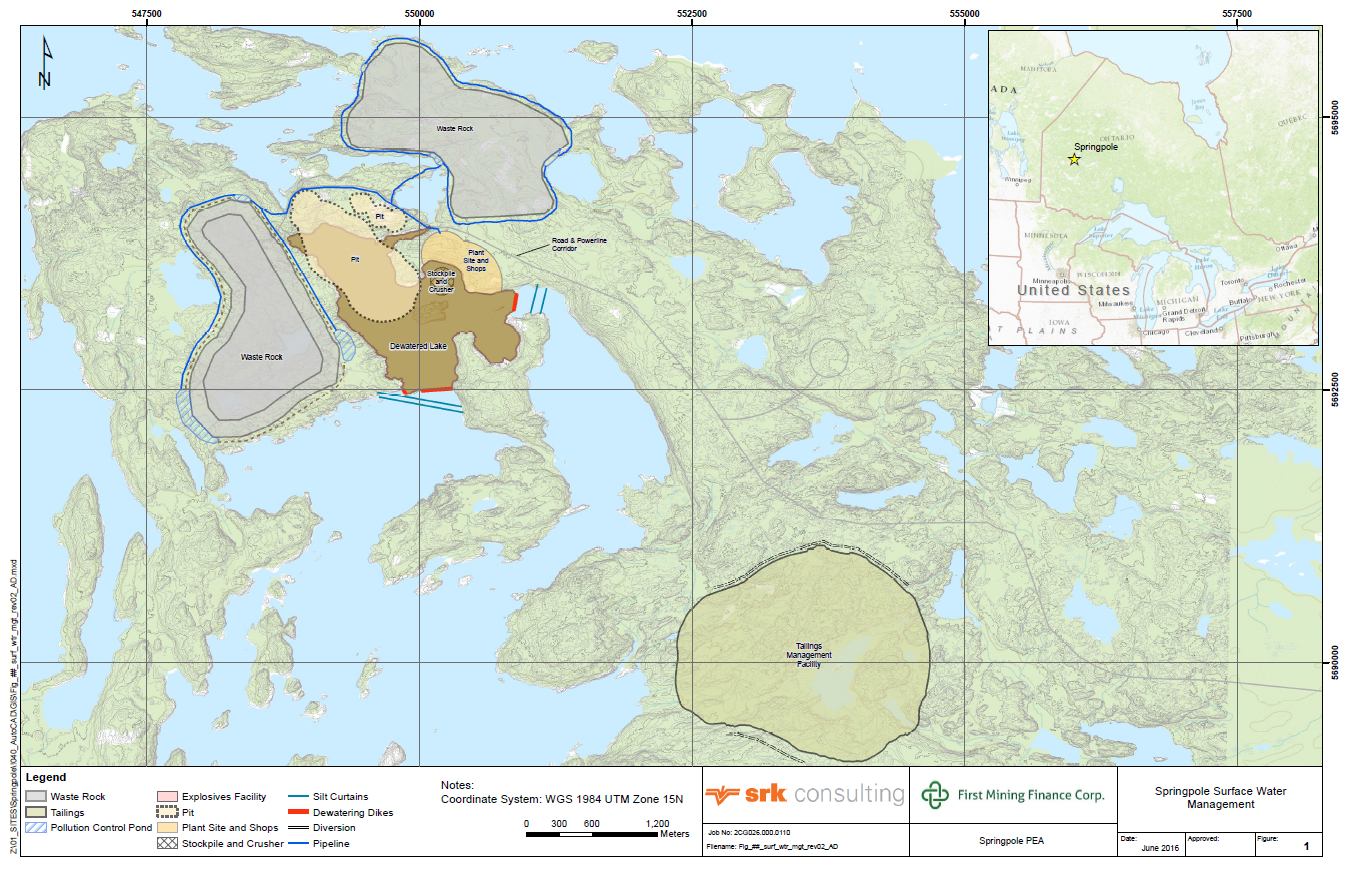
An estimated 21.7 million cubic metres of water will have to be removed from the area of Springpole Lake within the dewatering dikes. The PEA estimates it will take approximately 1 year to pump this water over the dikes. This can be accomplished during the mill construction phase.
The capital cost of construction of the dikes and dewatering is estimated by the PEA to be $32 million which is included in the total capital cost of the Project.
Mineral Resource Estimate
The mineral resource estimate set out in Table 9 below and which formed the basis of the PEA, was completed by Dr. Gilles Arseneau, P.Geo (APEGBC #23474), an independent “qualified person” as defined in NI 43-101. The effective date of this resource estimate is March 17, 2017. The mineral resource estimate prepared by SRK considers diamond drill holes drilled by different operators during the period 2003 to 2016. The majority of the drilling has been completed by the Project’s previous owner, Gold Canyon Resources Inc. (“Gold Canyon”). The mineral resource for the Springpole Project is supported by 644 core boreholes drilled by Gold Canyon. The geological and assay databases have been reviewed and audited by SRK. Dr. Arseneau is of the opinion that the current drilling information is sufficiently reliable to interpret with confidence the boundaries of the pit-shell and that the assay data is sufficiently reliable to support the mineral resource estimation.
Differences between the previously reported mineral resource estimate (as reported in the Technical Report dated October 17, 2012) are primarily related to the addition of drill holes completed by Gold Canyon in late 2012 and early 2013 as well as the four drill holes completed by First Mining in 2016 for metallurgical test purposes. The Gold Canyon drilling specifically targeted Inferred category material with the result that over 95% of the contained gold in the resource is now classified as Indicated and First Mining anticipates no further need for drilling to convert the remaining Inferred resources in preparation for a Pre-feasibility level assessment.
Additional information about the resource modeling methodology will be documented in the upcoming NI 43-101 technical report for the PEA.
Table 9 – Resource estimate for the Springpole Project
| Category | Quantity Mt | Grade Au (g/t) |
Grade Ag (g/t) |
Contained Metal Au (Moz) |
Contained Metal Ag (Moz) |
| Indicated | 139.1 | 1.04 | 5.4 | 4.67 | 24.19 |
| Inferred | 11.4 | 0.63 | 3.1 | 0.23 | 1.12 |
Notes
- These resource estimates have been prepared in accordance with NI 43-101 and the 2014 CIM Definition Standards. Mineral resources that are not mineral reserves do not have demonstrated economic viability. See cautionary notes at the end of this news release.
- Open pit mineral resources are reported at a cut-off grade of 0.4 g/t gold. Cut-off grades are based on a gold price of $1,400/oz and a gold processing recovery of 80% and a silver price of $15/oz and a silver processing recovery of 60%.
- Appropriate mining costs, processing costs, metal recoveries and inter ramp pit slope angles were used to generate the pit design.
- The estimated life of mine strip ratio for the resource estimate is 2.1.
- Rounding may result in apparent summation differences between tonnes, grade and contained metal content.
- Tonnage and grade measurements are in metric units. Contained gold and silver ounces are in troy ounces.
- All composites have been capped where appropriate.
Project Sensitivities
Project cash flow is highly sensitive to changes in the price of gold and silver as indicated in the vertical axis in Table 10 below. The Project is also sensitive to variations in capital and operating costs as indicated in the horizontal axis in Table 10. This table shows the effect of increasing or decreasing the price of gold and silver and capital expenditure and operating expenditure estimates for the Project by ±45%.
Table 10 – Project NPV sensitivity to variations in the price of gold and silver and capital & operating expenditures on a Post-Tax basis
| Total Project Operating and Capital Costs ($M) | ||||||||||
| Net Present Value @ 5% ($M) | 1,619 | 2,061 | 2,503 | 2,944 | 3,386 | 3,828 | 4,269 | |||
| -45% | -30% | -15% | 0% | 15% | 30% | 45% | ||||
| LOM Revenue ($M) | 2,667 | -45% | 498 | 241 | -22 | -316 | -624 | -931 | -1,239 | |
| 3,394 | -30% | 851 | 596 | 341 | 83 | -179 | -462 | -770 | ||
| 4,122 | -15% | 1,203 | 948 | 694 | 439 | 183 | -76 | -337 | ||
| 4,849 | 0% | 1,554 | 1,300 | 1,046 | 792 | 537 | 282 | 24 | ||
| 5,576 | 15% | 1,906 | 1,652 | 1,398 | 1,143 | 889 | 635 | 380 | ||
| 6,304 | 30% | 2,258 | 2,004 | 1,750 | 1,495 | 1,241 | 987 | 732 | ||
| 7,031 | 45% | 2,610 | 2,356 | 2,101 | 1,847 | 1,593 | 1,339 | 1,084 | ||
Risks and Opportunities
As with all mining ventures, a large number of risks and opportunities can affect the outcome of the Project. Most of these risks and opportunities are based on uncertainty, such as lack of scientific information (test results, drill results, etc.) or the lack of control over external factors (metal prices, exchange rates, etc.).
Subsequent higher-level engineering studies would be required to further refine these risks and opportunities, identify new risks and opportunities, and define strategies for risk mitigation or opportunity implementation.
The PEA identified a number of principal risks for the Project which are summarized below:
- Geological interpretation and mineral resource classification (13% of the resources used in the mine plan are Inferred);
- Due to a relatively small number of metallurgical samples tested, larger variations in mineralogy and metal recovery may exist than have been observed to date;
- Geotechnical and hydrogeological considerations;
- No information on baseline groundwater quality;
- No physical characterization of the tailings material has been done;
- No waste rock characterization has been done;
- Construction management and cost containment during development of the Project;
- High exposure to potential escalation of costs associated with latent ground conditions due to need for dewatering dykes and large, shallow tailings management facility;
- Given that most of the Portage Zone, which contains the majority of the ounces at the Project, lies under a small portion of Springpole Lake, the permitting period associated with the Project could be longer than assumed in the PEA study;
- Increased operating cost and/or capital cost; and
- Reduced metal prices.
The PEA also identified a number of opportunities to improve the economics of the Project. Areas that will be investigated to further enhance the Project include:
- More refined pit optimization parameters could result in better optimized open pit limits than the pit shell selected for the PEA;
- Better hydrogeological and geotechnical understanding may increase pit slope angles over those used in the PEA;
- There are other geophysical targets around the current resource, particularly to the southwest of the current resource. Additional drilling has the potential to add resources;
- Investigations may reveal that sufficient quantities of low permeability material for dam core construction may be available on-site and bedrock may be located at a shallower depth than assumed in the cost estimate;
- Lake dewatering could occur at a faster rate if the water was discharged into several different surrounding water bodies;
- Further metallurgical testing and refining milling processes may result in improved recoveries;
- The potential to upgrade the mineral resource classification of the deposit; and
- Improved metal prices.
Qualified Persons and NI 43-101 Technical Report
The PEA for the Project summarized here was completed by SRK (contributors listed in Table 11 below), and will be incorporated in an NI 43-101 technical report which will be available under the Company’s SEDAR profile at www.sedar.com, and on the Company's website, within 45 days of this news release.
Table 11 – PEA Contributors
| Qualified Person | Scope of Responsibility |
| Dr. Gilles Arseneau, PGeo Associate Consultant |
Geology |
| Dr. Adrian Dance, PEng Principal Consultant |
Metallurgy |
| Victor Munoz, PEng Senior Consultant |
Water Resources |
| Grant Carlson, PEng Senior Consultant |
Mining, Infrastructure |
| Bruce Murphy, FSAIMM Principal Consultant |
Geotechnical |
| Michael Royle, PGeo Principal Consultant |
Hydrogeology |
| Dr. Maritz Rykaart, PEng Principal Consultant |
Tailings Management |
| Mark Liskowich, PGeo Principal Consultant |
Environmental |
Readers are cautioned that the PEA is preliminary in nature and includes the use of Inferred resources, which are considered too speculative geologically to have the economic considerations applied to them that would enable them to be categorized as mineral reserves. Mineral resources do not have demonstrated economic viability and future in-fill drilling and scoping, pre-feasibility and feasibility studies will determine what percentage of the inferred resource can be placed into the mineable category. Thus, there is no certainty that the production profile concluded in the PEA will be realized. Actual results may vary, perhaps materially. The Company is not aware of any environmental, permitting, legal, title, taxation, socio-political, marketing or other issue which may materially affect this estimate of mineral resources. The projections, forecasts and estimates presented in the PEA constitute forward-looking statements and readers are urged not to place undue reliance on such forward-looking statements. Additional cautionary and forward-looking statement information is detailed at the end of this news release.
Qualified Person
Dr. Chris Osterman, P.Geo., CEO of First Mining, is the “qualified person” for the purposes of NI 43-101, and he has reviewed and approved the scientific and technical disclosure contained in this news release.
ABOUT FIRST MINING FINANCE CORP.
First Mining is a mineral property holding company whose principal business activity is to acquire high quality mineral assets with a focus in the Americas. The Company currently holds a portfolio of 25 mineral assets in Canada, Mexico and the United States with a focus on gold. Ultimately, the goal is to continue to increase its portfolio of mineral assets through acquisitions that are expected to be comprised of gold, silver, copper, lead, zinc and nickel.
ON BEHALF OF FIRST MINING FINANCE CORP.
“Keith Neumeyer”
Keith Neumeyer
Chairman
For more information contact:
Derek Iwanaka
Vice President, Investor Relations
Toll-free: 1-844-306-8827
Direct: 604-639-8824
Email: info@firstminingfinance.com
www.firstminingfinance.com
Cautionary Note Regarding Forward-Looking Statements
This news release includes certain "forward-looking information” and "forward-looking statements” (collectively "forward-looking statements”) within the meaning of applicable Canadian and United States securities legislation including the United States Private Securities Litigation Reform Act of 1995. These forward-looking statements are made as of the date of this news release. Forward-looking statements are frequently, but not always, identified by words such as "expects”, "anticipates”, "believes”, “plans”, “projects”, "intends”, "estimates”, “envisages”, "potential”, "possible”, “strategy”, “goals”, “objectives”, or variations thereof or stating that certain actions, events or results "may", "could", "would", "might" or "will" be taken, occur or be achieved, or the negative of any of these terms and similar expressions.
Forward-looking statements in this news release relate to future events or future performance and reflect current estimates, predictions, expectations or beliefs regarding future events and include, but are not limited to, statements with respect to: (i) the estimated amount and grade of Mineral Resources at the Project; (ii) the PEA representing a viable development option for the Project; (iii) construction of a mine at the Project and related actions, including dewatering activities; (iv) estimates of the capital costs of constructing mine facilities and bringing a mine into production, of sustaining capital and the duration of financing payback periods; (v) the estimated amount of future production, both produced and metal recovered; (vi) life of mine estimates and estimates of operating costs and total costs, net cash flow, net present value and economic returns from an operating mine constructed at the Project; (vii) investigation of opportunities to improve the economics of the proposed mine and the success of any such opportunities; and (viii) filing of the technical report on SEDAR and preparation of an Environmental Assessment. All forward-looking statements are based on First Mining's or its consultants' current beliefs as well as various assumptions made by them and information currently available to them. The most significant assumptions are set forth above, but generally these assumptions include: (i) the presence of and continuity of metals at the Project at estimated grades; (ii) the geotechnical and metallurgical characteristics of rock conforming to sampled results, including the quantities of water and the quality of the water that must be diverted or treated during mining operations; (iii) the capacities and durability of various machinery and equipment; (iv) the availability of personnel, machinery and equipment at estimated prices and within the estimated delivery times; (v) currency exchange rates; (vi) metals sales prices and exchange rate assumed; (vii) appropriate discount rates applied to the cash flows in the economic analysis; (viii) tax rates and royalty rates applicable to the proposed mining operation; (ix) the availability of acceptable financing under assumed structure and costs; (x) metallurgical performance; (xi) reasonable contingency requirements; (xii) success in realizing proposed operations; (xiii) receipt of permits and other regulatory approvals on acceptable terms; and (xiv) the fulfillment of environmental assessment commitments and arrangements with local communities. Although the Company’s management considers these assumptions to be reasonable based on information currently available to it, they may prove to be incorrect. Many forward-looking statements are made assuming the correctness of other forward looking statements, such as statements of net present value and internal rates of return, which are based on most of the other forward-looking statements and assumptions herein. The cost information is also prepared using current values, but the time for incurring the costs will be in the future and it is assumed costs will remain stable over the relevant period.
By their very nature, forward-looking statements involve inherent risks and uncertainties, both general and specific, and risks exist that estimates, forecasts, projections and other forward-looking statements will not be achieved or that assumptions do not reflect future experience. We caution readers not to place undue reliance on these forward-looking statements as a number of important factors could cause the actual outcomes to differ materially from the beliefs, plans, objectives, expectations, anticipations, estimates assumptions and intentions expressed in such forward-looking statements. These risk factors may be generally stated as the risk that the assumptions and estimates expressed above do not occur as forecast, but specifically include, without limitation: (i) risks relating to variations in the mineral content within the material identified as Mineral Resources from that predicted; (ii) variations in rates of recovery and extraction; (iii) the geotechnical characteristics of the rock mined or through which infrastructure is built differing from that predicted, the quantity of water that will need to be diverted or treated during mining operations being different from what is expected to be encountered during mining operations or post closure, or the rate of flow of the water being different; (iv) developments in world metals markets; (v) risks relating to fluctuations in the Canadian dollar relative to the US dollar; (vi) increases in the estimated capital and operating costs or unanticipated costs; (vii) difficulties attracting the necessary work force; (viii) availability of necessary financing and any increases in financing costs or adverse changes to the terms of available financing, if any; (ix) tax rates or royalties being greater than assumed; (x) changes in development or mining plans due to changes in logistical, technical or other factors; (xi) changes in project parameters as plans continue to be refined; (xii) risks relating to receipt of permits and regulatory approvals; (xiii) delays in stakeholder negotiations (including negotiations with affected First Nation groups); (xiv) changes in regulations applying to the development, operation, and closure of mining operations from what currently exists; (xv) the effects of competition in the markets in which First Mining operates; (xvi) operational and infrastructure risks; (xvii) management’s discretion to alter the Company’s short and long term business plans; and the additional risks described in First Mining's Annual Information Form for the year ended December 31, 2016 filed with the Canadian securities regulatory authorities under the Company’s SEDAR profile at www.sedar.com, and in First Mining’s Annual Report on Form 40-F filed with the SEC on EDGAR.
First Mining cautions that the foregoing list of factors that may affect future results is not exhaustive. When relying on our forward-looking statements to make decisions with respect to First Mining, investors and others should carefully consider the foregoing factors and other uncertainties and potential events. First Mining does not undertake to update any forward-looking statement, whether written or oral, that may be made from time to time by the Company or on our behalf, except as required by law.
Cautionary Note to United States Investors
This news release has been prepared in accordance with the requirements of the securities laws in effect in Canada, which differ from the requirements of U.S. securities laws. Unless otherwise indicated, all resource and reserve estimates included in this press release have been prepared in accordance with National Instrument 43-101 Standards of Disclosure for Mineral Projects ("NI 43-101”) and the Canadian Institute of Mining, Metallurgy, and Petroleum 2014 Definition Standards on Mineral Resources and Mineral Reserves. NI 43-101 is a rule developed by the Canadian Securities Administrators which establishes standards for all public disclosure an issuer makes of scientific and technical information concerning mineral projects. Canadian standards, including NI 43-101, differ significantly from the requirements of the United States Securities and Exchange Commission ("SEC”), and mineral resource and reserve information contained herein may not be comparable to similar information disclosed by U.S. companies. In particular, and without limiting the generality of the foregoing, the term "resource” does not equate to the term "reserves”. Under U.S. standards, mineralization may not be classified as a "reserve” unless the determination has been made that the mineralization could be economically and legally produced or extracted at the time the reserve determination is made. The SEC's disclosure standards normally do not permit the inclusion of information concerning "measured mineral resources”, "indicated mineral resources” or "inferred mineral resources” or other descriptions of the amount of mineralization in mineral deposits that do not constitute "reserves” by U.S. standards in documents filed with the SEC. Investors are cautioned not to assume that any part or all of mineral deposits in these categories will ever be converted into reserves. U.S. investors should also understand that "inferred mineral resources” have a great amount of uncertainty as to their existence and great uncertainty as to their economic and legal feasibility. It cannot be assumed that all or any part of an "inferred mineral resource” will ever be upgraded to a higher category. Under Canadian rules, estimated "inferred mineral resources” may not form the basis of feasibility or pre-feasibility studies except in rare cases. Investors are cautioned not to assume that all or any part of an "inferred mineral resource” exists or is economically or legally mineable. Disclosure of "contained ounces” in a resource is permitted disclosure under Canadian regulations; however, the SEC normally only permits issuers to report mineralization that does not constitute "reserves” by SEC standards as in-place tonnage and grade without reference to unit measures. The requirements of NI 43-101 for identification of "reserves” are also not the same as those of the SEC, and reserves reported by the Company in compliance with NI 43-101 may not qualify as "reserves” under SEC standards. Accordingly, information concerning mineral deposits set forth herein may not be comparable with information made public by companies that report in accordance with U.S. standards.